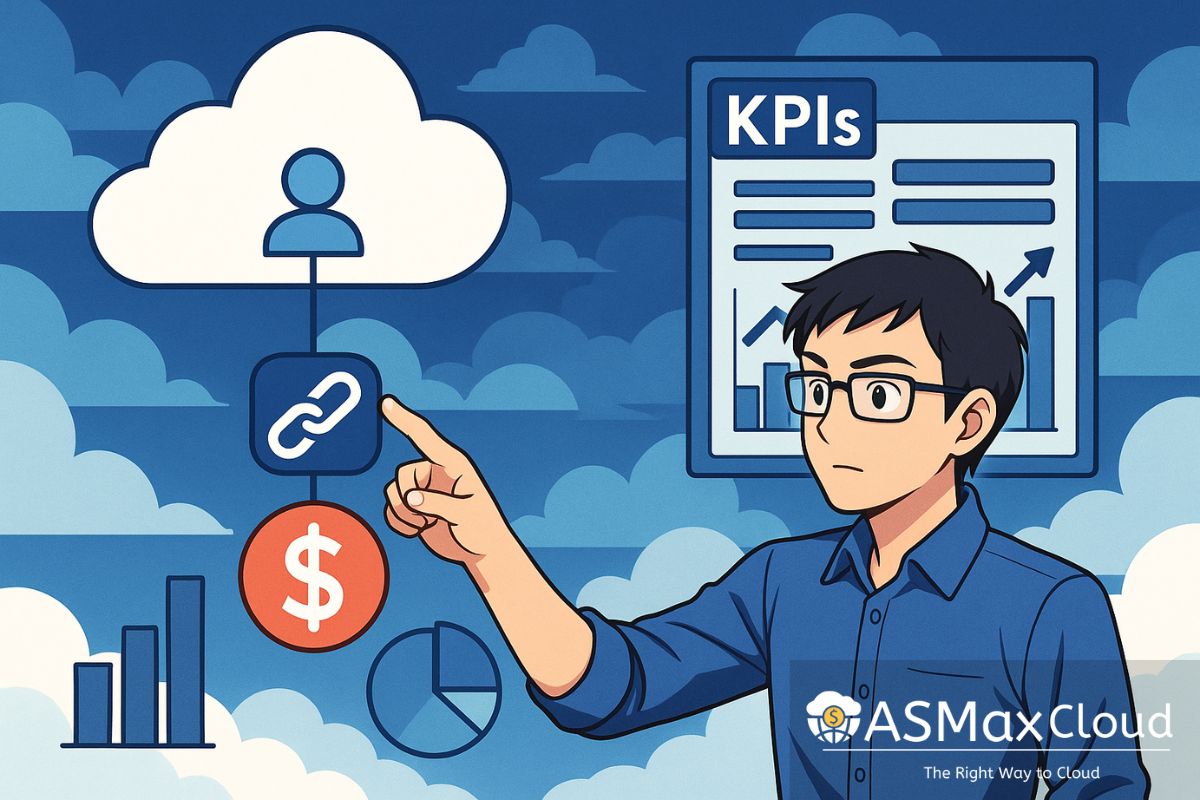
Organizations often suffer from a cascade of interrelated challenges that read like a tragedy-comedy script: without clear cost ownership, cost anomalies pop up like surprise plot twists in your monthly bill and go undetected for days; teams operate in silos like castaways on different islands—one squad’s heroic right‑sizing effort never reaches the others; and incentive structures reward feature velocity over fiscal responsibility, like paying Oscars for shipping bugs instead of bug fixes. This cocktail of chaos creates overprovisioned resources, reactive firefighting (think water pistols at a wildfire), and strategic misalignment. Linking cloud cost KPIs to specific team accountability is your superhero cape: it unites these islands, delivers real‑time insights, and marries engineering efforts with financial goals — the ultimate remedy for runaway expenses and fractured responsibility.
When engineering and product teams own specific cost metrics, they start treating cloud spend like a shared resource, not an invisible expense account. Assigning ownership of clear, measurable KPIs to the teams closest to code and architecture decisions creates natural incentives to optimize rather than overspend.
Before diving into our top KPIs (and a few bonus ones—because why stop at “just enough”?), remember these numbers aren’t arbitrary dashboard fillers. They act as gentle (or not-so-gentle) nudges: set a clear target, and your team will instinctively look for ways to hit it. Ready your witty commit messages and brace for some cost-conscious heroics.
Core Cloud Cost KPIs and Why They Matter
1. Cost per Feature Deployed
What it measures: Total cloud spend divided by the number of features released in a period.
Why it matters: Forces teams to weigh the marginal cost of every new widget or microservice.
Org benefit: More value per dollar and avoidance of feature bloat.
Example: An e‑commerce squad rolled out a personalized recommendation engine that spiked costs by $5,000/month. After right‑sizing storage tiers and merging some Lambda functions, they tamed it to $3,000—without breaking a sweat (or the code).
2. Budget Variance Percentage
What it measures: (Actual spend – Forecasted budget) ÷ Forecasted budget as a percent.
Why it matters: Encourages precise forecasting and early monitoring.
Org benefit: Predictable cash flow, fewer surprise invoices.
Example: The mobile app team predicted $20,000 in AWS spend; by shifting batch jobs to off‑peak hours, they kept variance under 5%, dodging the classic “Oops, did you charge us for that?” email.
3. Idle and Under‑Utilized Resource Ratio
What it measures: Percent of compute/storage running below utilization threshold.
Why it matters: Exposes zombie instances and oversized databases.
Org benefit: Lower waste, reduced technical debt, smaller attack surface.
Example: A backend team realized 30% of dev instances were idle overnight. They automated shutdowns during off‑hours, slashing idle resources to under 5% and saving $2,500 monthly—proof that even server ghosts need eviction notices.
4. Reserved Capacity Coverage
What it measures: Proportion of steady workloads covered by Reserved Instances or Savings Plans.
Why it matters: Incentivizes accurate traffic forecasts and discount commitments.
Org benefit: Stable, lower rates on long‑running services.
Example: A streaming platform saw its transcoding fleet hitting 70% capacity. Buying a one‑year Savings Plan shaved 30% off costs compared to on‑demand pricing—like finding a 30% off coupon for your monthly pizza delivery.
5. Anomaly Resolution Time
What it measures: Time from cost spike detection to resolution.
Why it matters: Drives faster incident response and better monitoring.
Org benefit: Fewer bill shocks, maintained trust between finance and dev teams.
Example: After an accidental eight‑hour data backlog, the team initially took three hours to fix it. A 30‑minute SLA spurred automation of throttling rules—now resolution happens in under 15 minutes, because nobody likes paying for runaway processes.
6. Cost Savings Initiative Success Rate
What it measures: Percentage of proposed cost‑reduction projects that hit their targets.
Why it matters: Rewards realistic planning and follow‑through.
Org benefit: Focus on initiatives that truly move the needle.
Example: An analytics group pitched five projects—right‑sizing clusters, Spot Instances, better caching, tiered storage, and refactored ETL. Four delivered or surpassed savings, yielding an 80% success rate and $50,000 in annual cuts.
Bonus KPIs to Keep You on Your Toes
Tag Compliance Rate
What it measures: Percentage of resources tagged according to policy.
Why it matters: Accurate cost allocation and visibility.
Org benefit: Granular billing breakdowns, easier chargebacks.
Example: After only 60% of resources were tagged correctly, the DevOps team enforced tagging in CI/CD pipelines—jumping compliance to 95% and preventing mysterious “unassigned” charges.
Cost per User Session
What it measures: Total cloud cost divided by active user sessions.
Why it matters: Links engineering decisions to user‑facing efficiency.
Org benefit: Balances performance with spend.
Example: A SaaS product found that each session cost $0.05; optimizing the caching layer cut it to $0.02, without users noticing a thing (except faster load times).
Monthly Anomalies Detected
What it measures: Number of cost anomalies flagged each month.
Why it matters: Measures the sensitivity of your monitoring setup.
Org benefit: Proactive cost governance.
Example: A fintech app went from zero alerts (and zero visibility) to catching five anomalies monthly after tuning thresholds—like watching a pot that finally stopped boiling over.
Percentage of Spot Instance Usage
What it measures: Share of compute covered by Spot Instances.
Why it matters: Encourages leveraging cost‑effective compute.
Org benefit: Dramatic cost reductions on non‑critical workloads.
Example: By shifting 40% of batch jobs to Spot Instances, the data engineering team saved 60% on compute costs—proof that a little risk can pay off big time.
Wrapping It Up
By embedding these KPIs into sprint goals, performance reviews, and post‑mortems, you turn cloud costs from an afterthought into a first‑class citizen. Suddenly, every dollar spent feels personal—like borrowing your teammate’s lunch money without asking. And that, dear reader, is how you weave cost-conscious decision-making into the DNA of your engineering and product teams, one witty commit message at a time.
